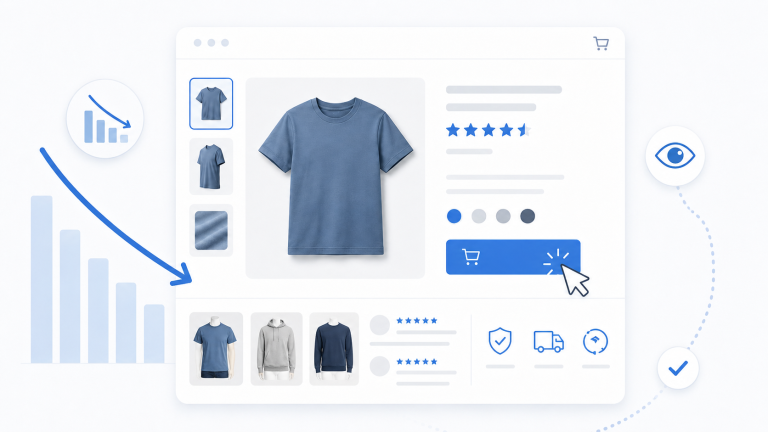
Your product detail page (PDP) is the most important real estate on your ecommerce site — and yet, it’s often the most neglected. You can pour budget into ads, craft perfect landing pages, and fine-tune your marketing strategy, but if the product page fails to convert, every click you paid for is wasted.
Throughout the article, I (Rashel Hariri) provide statements from my decade and a half of experience in marketing and eCommerce strategy.

“The PDP is the make-or-break point for ecommerce conversion. You can drive traffic all day long, but If your product page doesn’t sell, nothing else in your funnel matters.”
This guide will show you how to turn PDPs into high-performing conversion engines — with actionable benchmarks, optimization strategies, real-world case studies, and the trust-building tactics top ecommerce businesses use to increase sales.
What Is PDP Conversion Rate?
Your PDP conversion rate is the percentage of website visitors who land on a product detail page and complete a desired action — usually adding the product to cart or completing the checkout process.

It’s a critical metric because it measures how effectively your PDP content turns potential customers into buyers. It reflects not just the appeal of the product itself but also the page design, messaging, user experience, and social proof.
Even small lifts in PDP conversion can have outsized effects on revenue. For example, increasing your ecommerce conversion rate from 2.0% to 2.5% might seem minor, but at scale, that’s a 25% revenue increase without spending a dollar more on traffic.
PDP Conversion Benchmarks by Industry
While the average conversion rate varies widely by industry, here’s a rough guide for what good looks like:
- Beauty & Skincare: 2.5%–4%
- Apparel & Fashion: 1.8%–3%
- Consumer Electronics: 1.2%–2%
- Home Goods & Furniture: 1.5%–2.5%
- SaaS & Subscriptions: 3%–7%
Sourced from: https://www.ruleranalytics.com/blog/insight/conversion-rate-by-industry/ and https://www.shopify.com/ca/blog/ecommerce-conversion-rate
These numbers shift based on target audience, price point, and traffic source. But the underlying principle is constant: PDP performance is the linchpin of overall ecommerce conversion rate optimization.
3. Key Factors That Influence Conversion Rates
There are dozens of micro-elements that affect your PDP’s performance, but the most impactful tend to fall into a few core buckets:
Page Speed and Load Time
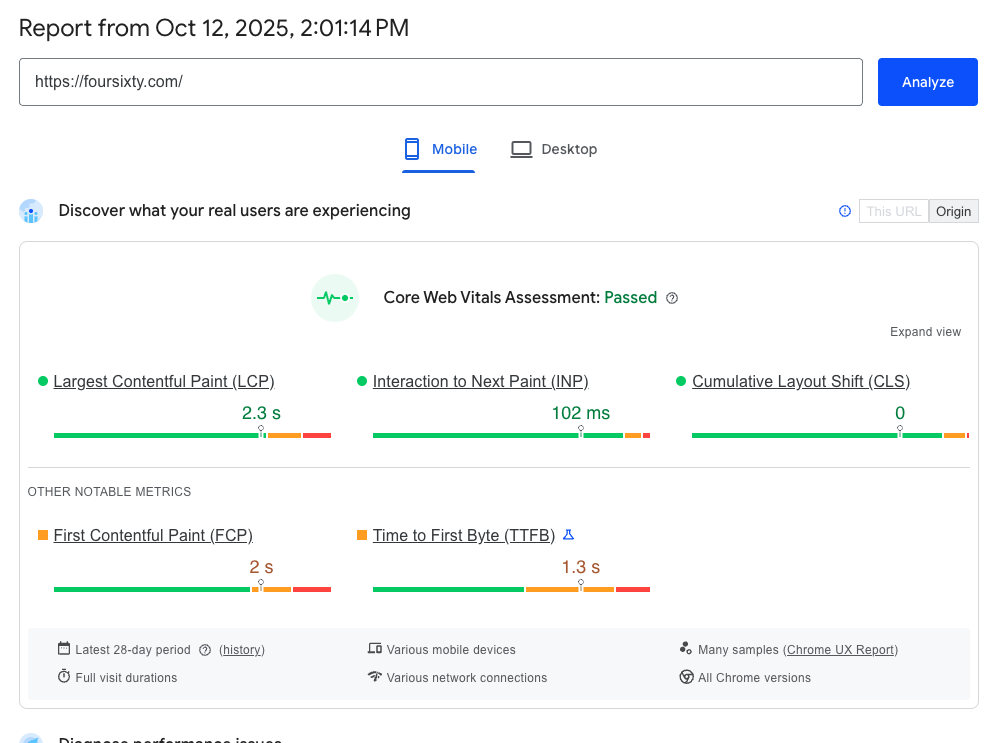
Slow pages kill conversions. A 1-second delay in load time can cut conversions by up to 7%. Optimize product images, scripts, and mobile responsiveness to keep pages loading fast across all devices.
Visuals & High-Quality Images

First impressions drive purchase decisions. Crisp, high-quality images from different angles, short videos, and lifestyle photography help users visualize ownership. Adding 360° views or short demo clips can boost engagement and time on page.
Trust Signals & Social Proof
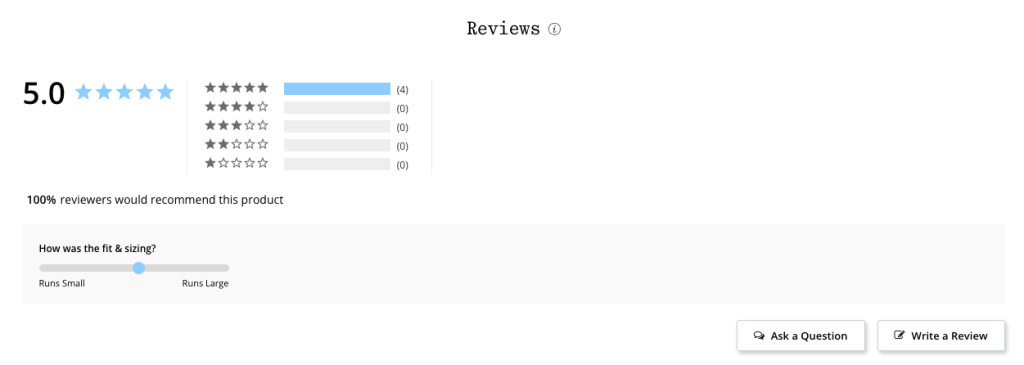
“Trust signals are the difference between a shopper hesitating and a shopper buying,” says Hariri.
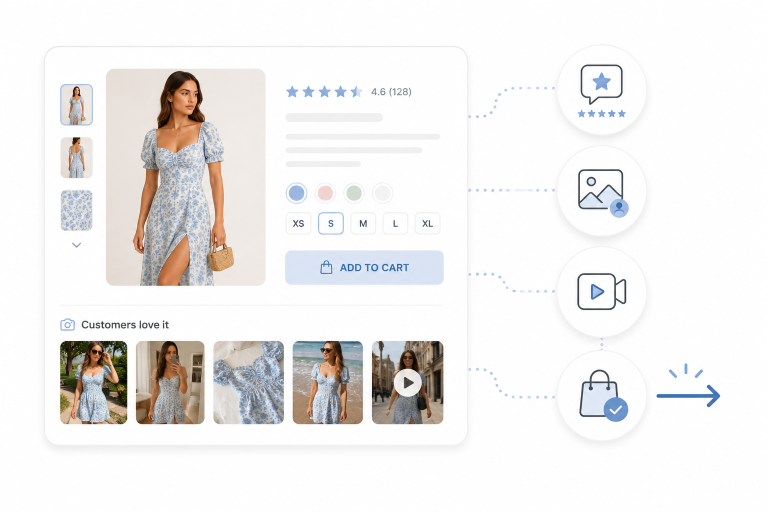
- Customer reviews: Authentic, balanced feedback builds credibility. A mix of 4- and 5-star reviews feels more real than a wall of perfect scores.
- Influencer UGC: Adds aspirational context by showing the product in the real world.
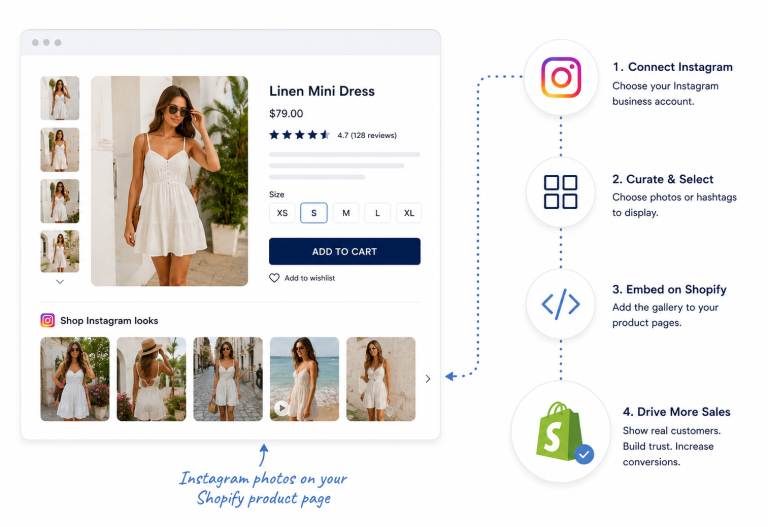
- Shoppable content: Collapses the gap between inspiration and purchase by letting users shop directly from real-life images and videos.
Every time you elevate these trust elements higher on the page, you reduce bounce and boost conversions.
Mobile User Experience (UX)
Most ecommerce traffic now comes from mobile devices, so your ecommerce product page must be designed mobile-first. Sticky CTA buttons, vertical layouts, fast loading times, and easy-to-scan product descriptions are essential.
A small tweak like a sticky Add to Cart CTA can have an outsized impact. Hariri recalls a brand that moved its button to remain visible while scrolling:
“Before, buyers had to scroll back up after reading reviews, and many dropped off. With a persistent button, the Add to Cart rate jumped noticeably.”
Common Mistakes That Lower Conversion Rates
Even experienced retailers make avoidable mistakes that drag down PDP performance:
- Vague messaging – Shoppers can’t quickly understand the value proposition.
- Poor product descriptions – Features are listed, but benefits are missing.
- Hidden trust signals – Reviews and UGC are buried too far down the page.
- Clunky mobile UX – Buttons and images don’t scale properly.
- Slow load times – Large media files and scripts bloat the page.
- Unclear pricing or payment options – Lack of clarity leads to hesitation.
These friction points increase bounce rates, lower average order value, and waste your acquisition spend.
5. A/B Testing for Continuous Improvement

A/B testing is the backbone of conversion rate optimization (CRO). Rather than relying on assumptions, use testing tools to learn what works for your audience.
What to test:
- CTA button – Placement, size, and color can influence click-throughs.
- Page design – Layout changes can affect scroll behavior and engagement.
- Copy and messaging – Test long vs. short product descriptions.
- Social proof placement – Move reviews higher and compare conversion lift.
- UGC vs. brand images – See which imagery drives a higher add-to-cart rate.
Track results with tools like Google Analytics, heatmaps, and session replay tools to understand not just what changed conversions, but why.
Case Study: +23% Revenue Lift with Shoppable UGC

One of the most striking examples of PDP optimization comes from Frankies Bikinis, which used Foursixty to transform its PDP experience.
By pulling in influencer UGC, customer content, and shoppable galleries directly into product pages, Frankies made its PDPs more dynamic, trustworthy, and conversion-focused.
- 23% of total revenue was influenced by Foursixty
- 19% of all orders came directly through UGC-driven content
This wasn’t a massive redesign — just smart use of social proof and shoppable media.
Other brands have seen similar results:
- MICHI achieved a 51× ROI in just 30 days by integrating Foursixty-powered PDP galleries.
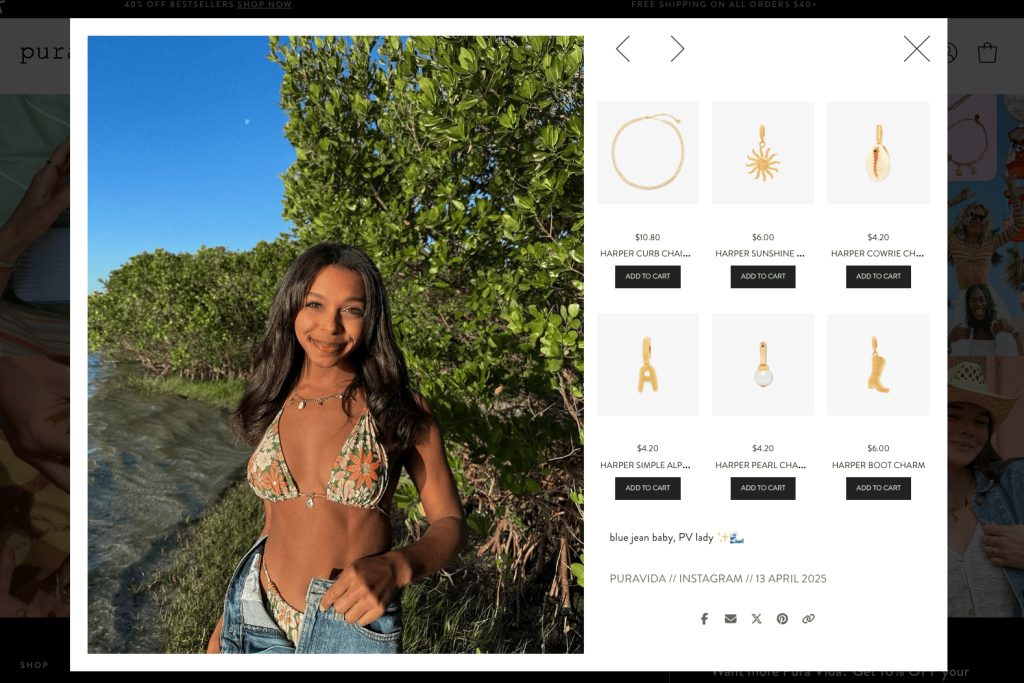
- Pura Vida Bracelets transformed social media engagement into on-site conversions by surfacing influencer content on PDPs.
The lesson: blending trust signals, social content, and frictionless CTAs is one of the fastest ways to achieve a high conversion rate.
Tools for Measuring PDP Performance
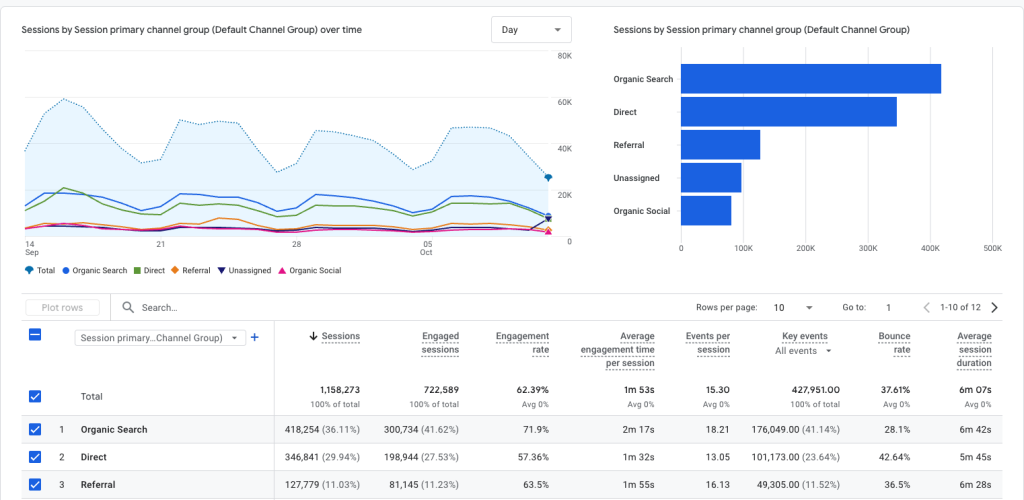
To manage PDP optimization at scale and track results beyond just conversion rate, use a combination of analytics, testing, and CRO marketing tools:
- Google Analytics – Measure add-to-cart rate, bounce, exit, and average order value.
- Hotjar / FullStory – Use heatmaps and scroll tracking to understand behavior.
- VWO / Optimizely – Run A/B tests on messaging, CTA buttons, layouts, and more.
- Klaviyo / Nosto – Personalize product page content to audience segments.
- Foursixty – Add shoppable UGC galleries and track how they impact conversions.
Also monitor metrics beyond conversion rate:
- Scroll depth – Are users reaching your reviews or FAQs?
- Time on page – Longer sessions often indicate higher buying intent.
- Return rate – High returns may signal misleading content.
- Exit rate – Identify where shoppers drop off in the funnel.
Together, these data points paint a complete picture of your PDP’s user experience and performance.
CTA: Boost Your PDP Conversion Rate With Foursixty
Your PDP isn’t just another page — it’s the moment of truth for your online store. Optimizing it for clarity, trust, and seamless UX is how you go from clicks to customers.
The fastest way to accelerate your results? Foursixty.
By integrating user-generated content, shoppable influencer galleries, and authentic social proof directly into your ecommerce product pages, Foursixty turns Tiktok and Instagram track into actions including conversions. With proven results like 23% of revenue influenced and 19% of orders driven by UGC, it’s the tool top ecommerce businesses use to achieve higher conversion rates. This is a big deal, as nearly one quarter of revenue is being generated for a fraction of the price of paid ads or more traditional marketing tactics. .
Book a demo with Foursixty and see how quickly your PDP conversion rate can climb.
Schema and SEO Enhancements
To help this article (and your PDPs) perform better in search engines, implement:
- FAQ schema for your PDP FAQs
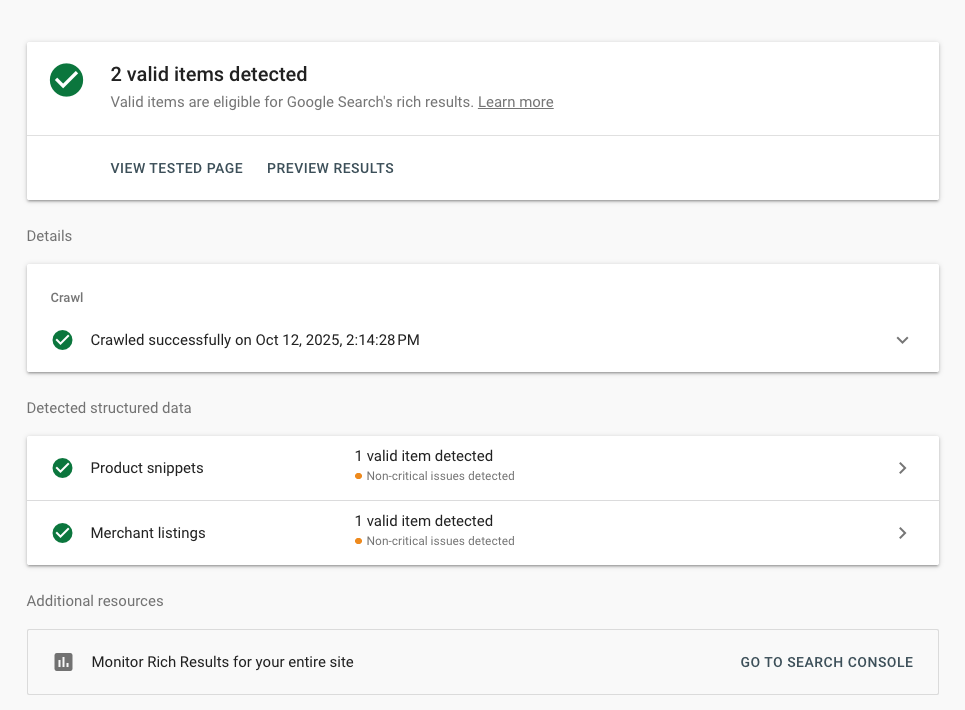
- Product schema with name, price, images, and reviews
- Breadcrumb schema for improved crawlability
- Alt text with relevant keywords for all product imagery
Final Takeaway
Conversion rate optimization doesn’t happen in a vacuum. It happens on the PDP, where product, proof, and persuasion intersect. A clear message, strong CTA, authentic social proof, and fast, mobile-first design are the cornerstones of a high-converting PDP. Add Foursixty into that mix, and you’re no longer leaving conversions to chance — you’re engineering them.